Shasta County 48-Hour Resource Accessibility
Analysis
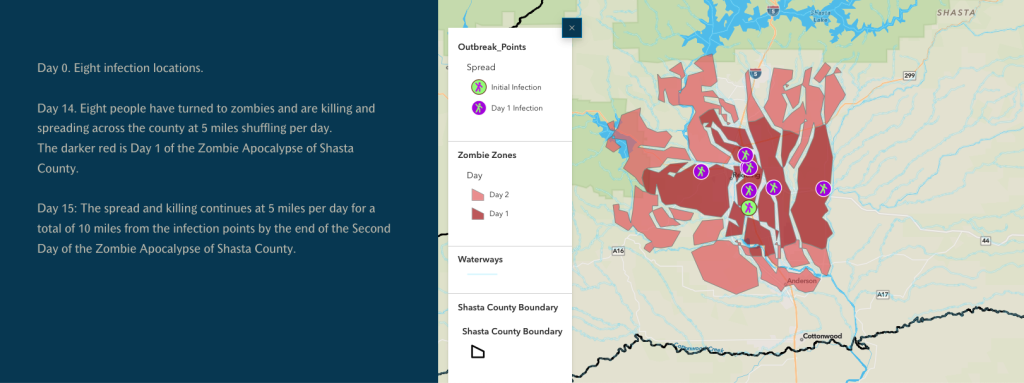
A routine shopping trip becomes the worst outbreak in Shasta County history. Within hours, infected individuals have carried the virus to seven more locations creating eight zombie infection clusters spreading outward on foot. By the time authorities understand what they are dealing with, it is already too late.
~The Objective: Determine where to find food, water, shelter, and safety within a 48-hour window before the infected reached most of Shasta County’s population centers.
~The Methodology: Cost Distance analysis modeled the outbreak spreading outward at five miles per day, with terrain, waterways, and slope acting as real barriers that shaped where the threat could and could not go. A Weighted Overlay scored every location outside the active danger zones on four survival criteria, with food and defense resources carrying the most weight.
~The Insight: Demonstrated that the areas with the most survival resources are the most dangerous places to be because they are located within the initial outbreak zones. The problem is not unique to zombie fiction. It is a real challenge in disaster planning.
Shasta County Environmental Cleanup Dashboard
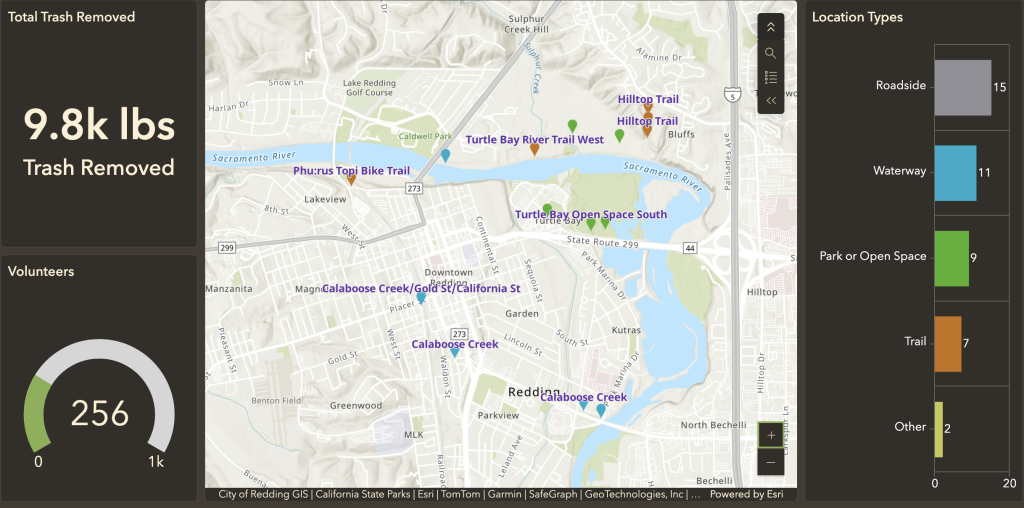
Cleanup efforts in Shasta County were spread across multiple organizations, each tracking their own data separately. There was no shared record of what had been collected, where, or by how many people.
~The Objective: Centralize cleanup data to show the scale of volunteer impact and where restoration efforts were happening across the county.
~The Methodology: Built a Survey123 form to collect cleanup event data and an ArcGIS Dashboard to display it in real time. The dashboard tracks total trash removed, volunteer counts, cleanup locations, and site type breakdowns including roadside, waterway, park, trail, and open space to document specific stewardship efforts and identify areas requiring ongoing maintenance.
~The Insight: The dashboard gives multiple organizations a shared, live record of trash removed, volunteers involved, and locations served. Scattered, individual records are now visible on a single source that shows what the collective effort actually looks like.
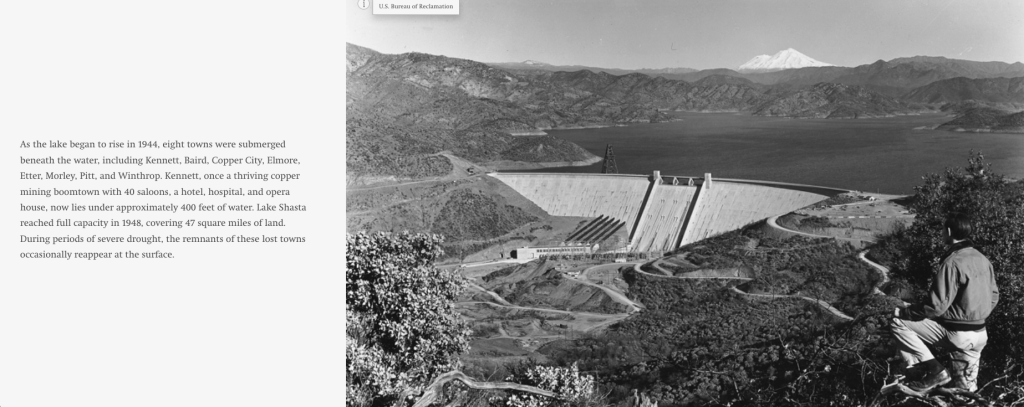
Shasta Dam Raise
Impact Analysis
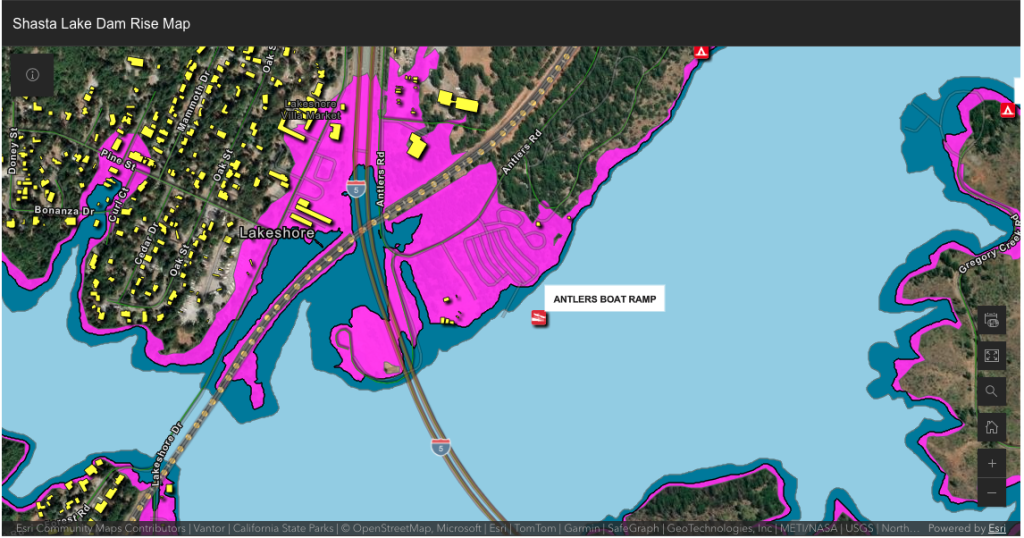
The proposed 18.5-foot raise of the Shasta Lake Dam creates a complex conflict between increased water storage and the permanent loss of existing shoreline infrastructure. Without a detailed spatial assessment, the impact on cultural sites, roads, and recreation areas remains unclear.
~The Objective: Map projected water levels to show what shoreline infrastructure, cultural sites, access roads, and recreation areas would be permanently submerged if the dam raise proceeds
~The Methodology: Used Digital Elevation Models to generate three water level surfaces: current full pool, the proposed new pool at 1,088.5 feet, and the additional take line above the new pool elevation.
~The Insight: The rise would submerge significant portions of local infrastructure, providing a foundation for assessing whether the benefit of increased storage outweighed the cost of the cultural and physical loss.
Development & the River
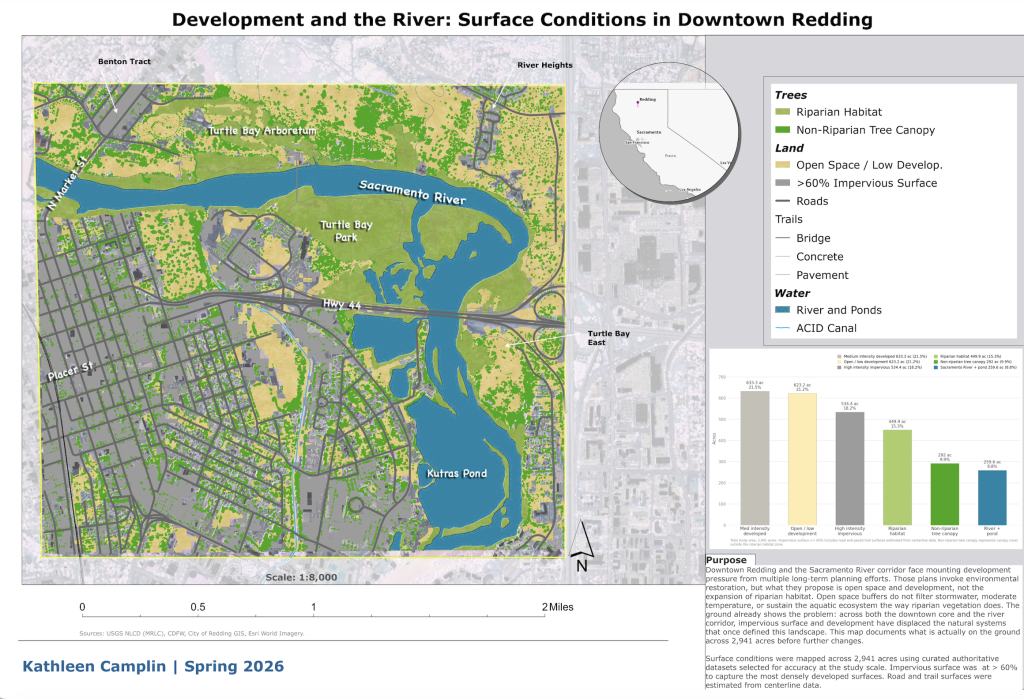
Downtown Redding and the Sacramento River corridor cover 2,941 acres of land where impervious surfaces and urban development have physically displaced the natural landscape. While the riverfront is often designated as open space, the ground reality shows a network of roads and concrete that has replaced the area’s original natural systems. This map documents the current footprint, showing exactly where built infrastructure now dominates the river corridor.
~The Objective: Produce a high-resolution cartographic print to document current surface conditions and and show exactly where built surfaces have replaced the trees and habitats that once defined the river’s edge.
~The Methodology: Mapped surface conditions across a 2,941-acre study area using curated datasets from USGS NLCD and local sources. The analysis isolated areas with over 60% impervious cover and used buffered centerline data to calculate the physical footprint of roads and trails, allowing for a clear distinction between hardscape infrastructure and the remaining open space or tree canopy.
~The Insight: Nearly 40% of the study area is already covered by medium to high-intensity development, while riparian habitat has been reduced to just 15.3%, highlighting a critical gap between restoration goals and the actual expansion of hardscaped surfaces.
History & the City of
Shasta Lake
The City of Shasta Lake grew out of five separate construction camps built for the Shasta Dam workforce. While an ArcGIS Story Map existed to document this history, the content was outdated, poorly organized, and lacked the visual quality and accessibility required for a public city resource.
~The Objective: Overhaul of the existing Story Map to improve historical accuracy and narrative flow. The goal was to produce a polished, legally compliant, and accessible digital archive that clearly connects the city’s origins to its current layout.
~The Methodology: Restructured the narrative by auditing existing content against primary and secondary sources. Sourced new high-resolution imagery, cleared all copyright and licensing requirements, and implemented alt-text across the entire platform for ADA accessibility. The updated Story Map utilizes linked reference maps to spatialize the transition from federal camps to modern neighborhoods.
~The Insight: Refining and centralizing this data shows that the city’s modern footprint is the direct physical legacy of the original five camps. By fixing the narrative structure and technical gaps, the project transformed a degraded document into a functional, permanent record of the city’s evolution.
Municipal & Infrastructure Data
This section features municipal data work from an internship with the City of Shasta Lake and a spatial analysis project for City of Redding parks. The internship included reconciling historical lot line adjustments from scanned paper maps into a live parcel dataset and establishing a citywide sign and post inventory under MUTCD standards. The Redding project built a new spatial dataset for 64 parks, mapping internal path networks and documenting ADA parking conditions. All three projects involved incomplete source materials and required independent decisions about how to structure data for ongoing city use.
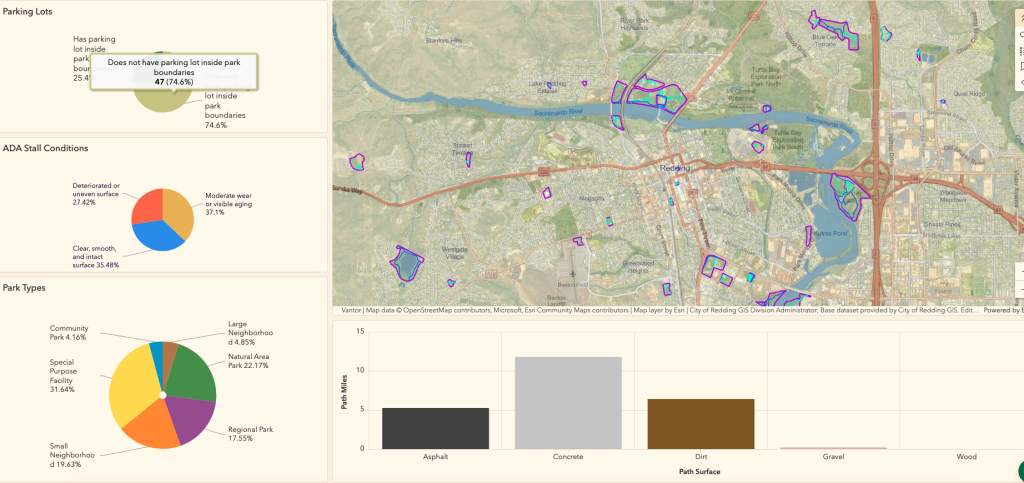
Park Paths and ADA Inventory
The City of Redding maintains an extensive trail system but had no standardized dataset documenting internal path networks inside park boundaries. Without that data, there was no way to assess the actual accessibility or condition of walkways and parking facilities across the city’s parks.
~The Objective: Create a comprehensive inventory of internal path networks and ADA parking stalls across sixty-four city parks to identify specific access limitations.
~The Methodology: Digitized every walkway, connector, and informal path using aerial imagery and Street View, classifying them by surface type, path type, and condition. Every ADA parking stall was inventoried and assessed for surface type and condition. The final data was integrated into a live dashboard, allowing the full dataset to be filtered by park type, surface material, and ADA stall condition.
~The Insight: Twenty-three of the 64 parks had at least one significant access limitation, from unpaved surfaces and stairs to deteriorated pavement. These issues were distributed throughout the city rather than concentrated in one area, indicating that accessibility gaps resulted from varying park ages and original designs rather than geography.
Historical Parcel Line Adjustments
The City of Shasta Lake GIS Department maintained a record of historical property line adjustments on scanned paper maps that had never been entered into the digital parcel dataset. This internship project reconciled those records with the current dataset to ensure the historical adjustments were digitally captured.
~The Objective: Digitally record historical property line adjustments by adding pins to the correct locations within the current parcel dataset using ArcGIS Pro.
~The Methodology: Digitized pins for every historical parcel adjustment by identifying map panels from scanned book pages and interpreting handwritten annotations. Matches were traced across surrounding geometry when original APNs no longer existed in the current dataset, with every point cross-referenced between the source map, an Excel change log, and the ArcGIS attribute table.
~The Insight: The process uncovered pre-existing inconsistencies where attribute table points had no corresponding entry in the change log. These discrepancies appeared across multiple map books, indicating a systemic disconnect between the spatial data and the tabular records rather than isolated errors
Street Sign and Post Inventory
The City of Shasta Lake had GPS locations for sign posts and sign points in its dataset, but the posts had no IDs and the sign points had no attribute data at all. This internship project filled in that data and expanded the scope to a full citywide sign inventory.
~The Objective: Populate and standardize the street sign and post database using field photos attached to each post record and added new sign points in the dataset.
~The Methodology: Digitized new sign points where records were missing and populated attribute data for existing posts and signs using attached field photos as the primary source. Each post was assigned a unique ID and classified by material and condition, while sign points were updated with specific sign types and MUTCD codes. Every entry was cross-referenced against the visual evidence in the photos to ensure the digital dataset accurately reflected the physical inventory.
~The Insight: The field photos revealed that the original GPS collection had missed numerous physical signs entirely. The dataset was not just missing attribute data but missing whole records, which only became apparent by checking every photo against every point.